This article will give you the critical tools to wide receiver PPR scoring. This is a helpful guide to the position and explains why D.J. Moore is destined for disappointment in Chicago.
Target Volume is King
The most important factor in wide receiver scoring is target volume. With more volume comes more points.
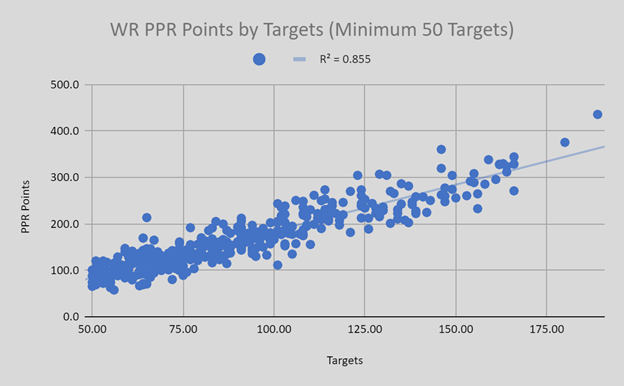
Plotted on the graph below are player targets (horizontal axis) and PPR points (vertical axis) for wide receivers with more than 50 targets in a season since 2017. As you can see in the graph below, there is a strong correlation between targets and points.

Overall, there is an r-squared of 0.855, which means targets explain 85.5% of PPR scoring. This is as big of a correlation you will find between a player’s stats and the points the player will score.
Since 2017, wide receivers with more than 50 targets averaged 1.83 PPR points per target. Those wide receivers with 100 over more targeted averaged 1.89 PPR points per target. This stat is highly variable from year to year, as you can see in the graph below which has points per target (horizontal axis) along with the following season’s points per target (vertical axis).

Of wide receivers with 50 targets in back-to-back seasons, the r-squared between points per target in the two seasons is 0.07. In other words, a wide receiver’s performance in points per target only explains 7% of the player’s performance the following year.
One of the keys to understanding the wide receiver position is understanding the variability of scoring per target by year. Much of wide receiver scoring depends on touchdown scoring, which can be fluky from year to year. A good thing to remember is high per-target efficiency is not predictive of high future per-target efficiency. Likewise, a low per-target efficiency does not predict high future per-target efficiency.
More Durable Metrics
While wide receiving points-per-target is highly variable from year to year, other metrics are more durable.
Targets Per Route Run
For example, the percentage of routes a wide receiver (TPRR) is targeted on significantly correlates year to year. In the graph below, the TPRR of wide receiver (horizontal axis) is compared against the following season’s TPRR (vertical axis).
