For those who are new to the feature, here's the deal: every week, I break down a topic related to regression to the mean. Some weeks, I'll explain what it is, how it works, why you hear so much about it, and how you can harness its power for yourself. In other weeks, I'll give practical examples of regression at work.
In weeks where I'm giving practical examples, I will select a metric to focus on. I'll rank all players in the league according to that metric and separate the top players into Group A and the bottom players into Group B. I will verify that the players in Group A have outscored the players in Group B to that point in the season. And then I will predict that, by the magic of regression, Group B will outscore Group A going forward.
Crucially, I don't get to pick my samples (other than choosing which metric to focus on). If I'm looking at receivers and Justin Jefferson is one of the top performers in my sample, then Justin Jefferson goes into Group A, and may the fantasy gods show mercy on my predictions.
And then because predictions are meaningless without accountability, I track and report my results. Here's last year's season-ending recap, which covered the outcome of every prediction made in our seven-year history, giving our top-line record (41-13, a 76% hit rate) and lessons learned along the way.
Our Year to Date
Sometimes, I use this column to explain the concept of regression to the mean. In Week 2, I discussed what it is and what this column's primary goals would be. In Week 3, I explained how we could use regression to predict changes in future performance-- who would improve, who would decline-- without knowing anything about the players themselves. In Week 7, I explained why large samples are our biggest asset when attempting to benefit from regression.
Sometimes, I point out broad trends. In Week 5, I shared twelve years worth of data demonstrating that preseason ADP held as much predictive power as performance to date through the first four weeks of the season.
Other times, I use this column to make specific predictions. In Week 4, I explained that touchdowns tend to follow yards and predicted that the players with the highest yard-to-touchdown ratios would begin outscoring the players with the lowest. In Week 6, I explained that yards per carry was a step away from a random number generator and predicted the players with the lowest averages would outrush those with the highest going forward. In Week 8, I broke down how teams with unusual home/road splits usually performed going forward and predicted the Cowboys would be better at home than on the road for the rest of the season.
The Scorecard
Statistic Being Tracked | Performance Before Prediction | Performance Since Prediction | Weeks Remaining |
---|---|---|---|
Yard-to-TD Ratio | Group A averaged 17% more PPG | Group B averages 10% more PPG | None (Win!) |
Yards per carry | Group A averaged 22% more yards per game | Group B averages 41% more yards per game | 1 |
Cowboys Point Differential | Cowboys were 90 points better on the road than at home | Cowboys are 6 points better at home than on the road* | 9 |
Our "low volume, high efficiency" Group A has seen its rush attempts decline every week so far (though all three weeks are higher than its pre-prediction baseline). On the other hand, our "high volume, low efficiency" Group B has seen its rush attempts increase every week (again, all three weeks are above the pre-prediction baseline). As a result, Group A has been more and more reliant on maintaining a high ypc to keep pace.
This is bad news because after another big week, Group B has once again passed Group A in yards per carry; our "inefficient" backs are averaging 5.15 ypc since the prediction, while our "efficient" backs are at 4.83.
There's a lesson in here about picking our samples, too. I always say that I don't cherry-pick names; if a player is at the top of a statistic that is traditionally unstable, I will pick that player to regress, even if he's Derrick Henry or Saquon Barkley. It's not especially surprising that those are the two best-performing backs in Group A. But it's much more surprising to see Tank Bigsby and Tyrone Tracy Jr. join them near the top, while J.K. Dobbins and Jordan Mason (who ranked 3rd and 4th in yards per game at the time of the prediction) have both fallen off substantially.
If I were picking and choosing who would regress, I probably would have bet on Dobbins and Mason sustaining their performance and Bigsby and Tracy falling off. I certainly wouldn't have bet on Najee Harris and D'Andre Swift to both average 6 yards per carry and 100 yards per game for Group B. (Harris has topped 100 yards every week since the prediction, tying Joe Mixon for the longest such streak of the season.) This is, of course, precisely why I don't pick and choose who will regress.
Our Cowboys prediction was that they'll play worse on the road than at home (as measured by point differential). It gets an asterisk to this point because they haven't played a home game yet (and they won't play one this week, either). Still, they did suffer their first road loss of the season last week, so that's a start.
Predicting Regression In An Unfamiliar World
I wrote at the beginning of the year that this column has four main goals:
- to persuade you that regression is real and reliable,
- to provide actionable examples to leverage in your fantasy league,
- to educate you on how and why regression is working, and
- to equip you with the tools to find usable examples on your own.
Having (hopefully) made some headway on the first three goals, I want to focus on the fourth.
It's hard enough as a football fan to know whether a "traditional" stat is meaningful or not. ("Meaningful", in this case, means "likely to remain stable going forward".) The research on yards per carry has been clear for decades and I still get pushback when I bring it up.
But we live in a world where new statistics are introduced seemingly every day. There was a time when receiving yards per game was the cutting edge for measuring receiver play. If you really wanted to dig deep, perhaps you'd look into yards per target.
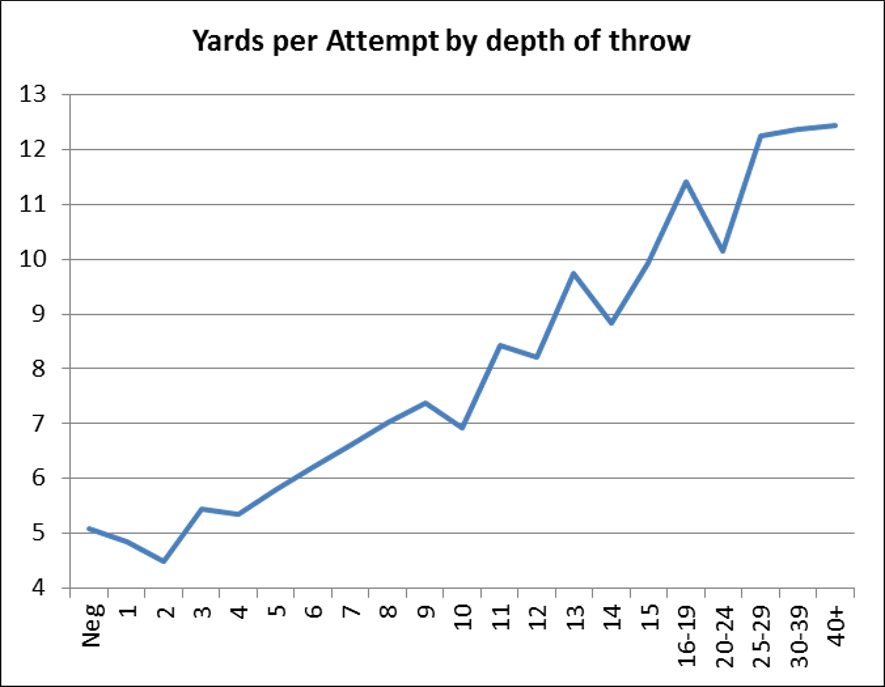
(As a brief aside, yards per target is not a very good efficiency stat. It strongly favors deep threats-- roughly 50% of the variation is explained by a player's yards per reception average. Here is an article from Chase Stuart of Football Perspective illustrating how yards per attempt for quarterbacks-- and by extension, yards per target for receivers-- is largely a function of the depth of the throw.)
After yards per target, people turned to yards per team pass attempt and yards per route run to evaluate receivers. (These are both much better measures of efficiency.) And the options have only further multiplied from there-- fans today who want to know how good a receiver is at getting open can consult NextGenStats' Average Separation, ESPN's Open Score, FantasyPoints Average Separation Score, and Matt Harmon's Reception Perception, just to name four different statistics that purport to measure the same thing but return wildly divergent results.
In a world where we're inundated with ever-more-complicated statistics all claiming to be the newest and best measure of play-- and especially when those stats frequently find themselves in strong disagreement with each other-- how can anyone be an informed consumer?
I don't have a perfect answer to this. But I do have a quick trick that I use to help sort the wheat from the chaff.
When You Can't Have The Best...
The gold standard measure of how much a stat might regress is something called stability testing. By comparing performance in one sample to performance in another, we can determine how similar those performances are and how much of a player's performance carries over from one game to the next, from one season to the next. Something like broken tackles, it turns out, is pretty stable. The backs who break a lot of tackles in one year also tend to break a lot of tackles in the next year.
Something like yards per carry, on the other hand, is not stable at all. I've already run down some of the studies, but you can see the results in the predictions from this column, too. Year after year, prediction after prediction, we see both high-YPC backs and low-YPC backs regress to virtually the same average. In the history of Regression Alert-- across 12 predictions and more than 7,000 carries-- Group A has fallen from 5.61 yards per carry to 4.54 while Group B has risen from 3.61 to 4.51.
But running stability testing is probably going to be beyond the abilities (or the inclinations) of most fantasy football players, and ordinarily, we can't just create eight years' worth of prediction history to look back on. (Additionally, just because a statistic is stable doesn't necessarily mean it's useful. Sack rate is one of the most stable quarterback stats, but it's also useless for fantasy football purposes unless you're in the rare league that penalizes quarterbacks for sacks.)
... Don't Underestimate the "Smell Test"
So when you encounter a brand new stat, what can you do to tell if it's a useful stat or not? I'm a big fan of a concept that I call "the leaderboard test", that statisticians call "face validity", and that the rest of us call "the smell test". Just from looking at a list, how well does it match our intuitions of what that list should look like?
I like a statistic called Adjusted Net Yards per Attempt, or ANY/A. It's a quarterback's yards per attempt, but it gives a 20-point bonus for touchdowns, a 45-point penalty for interceptions, and includes sacks and yards lost to sacks. Why do I like it? Because I think the face validity is high. Among all retired quarterbacks, here are the Top 10 passers in ANY/A (with a 2500-attempt minimum):
- Otto Graham
- Peyton Manning
- Norm Van Brocklin
- Drew Brees
- Tom Brady
- Tony Romo
- Philip Rivers
- Steve Young
- Kurt Warner
- Joe Montana
Maybe that's not a perfect list. Most would probably have Tom Brady higher and Tony Romo lower. Some are undoubtedly wondering where the hell Dan Marino is (he's 13th) or who the hell Norm Van Brocklin is. But seven of those ten gentlemen were among the finalists for the NFL's 100th Anniversary team (yes, Van Brocklin was one of them). And the three exceptions (Romo, Rivers, and Warner) aren't exactly chopped liver. This list has a high degree of face validity-- it appears to be measuring what we want it to be measuring.
Here's the leaderboard for 2024 so far among players with at least 120 attempts:
- Lamar Jackson (9.14)
- Josh Allen (8.34)
- Jared Goff (7.94)
- Jayden Daniels (7.60)
- Brock Purdy (7.46)
- Sam Darnold (7.27)
- Joe Burrow (7.27)
- Derek Carr (7.09)
- Justin Herbert (7.00)
- Baker Mayfield (6.85)
Again, it's not a perfect list, and given the small sample size, we should expect a degree of movement over the rest of the season-- but if you have a favorite candidate for midseason MVP, odds are good he's near the top. Maybe it's a surprise to see Carr so high (though it's worth noting that the Saints average 28 points per game in his five appearances, which would rank 6th for the season). Given that ANY/A has such a high degree of face validity, we should at least be open to the possibility that he'll surprise us down the stretch.
Let's compare this to another stat. The NFL has been using its player tracking data to create a suite of "Next Gen Stats" to help fans evaluate the game. They use this to produce one of the separation metrics I mentioned above. Here's the Top 10 so far this year:
- Ja'Tavion Sanders
- Jordan Whittington
- Noah Fant
- Mark Andrews
- Cole Kmet
- Jayden Reed
- Tyler Conklin
- Tucker Kraft
- Khalil Shakir
- Rashee Rice
Is that how you'd expect a list of the top separators to look?
Here's the same list from 2023:
- Rondale Moore
- Luke Musgrave
- Rashee Rice
- Cole Kmet
- Gerald Everett
- Wan'Dale Robinson
- Jonnu Smith
- Dalton Kincaid
- Jaxon Smith-Njigba
- Chigoziem Okonkwo
and from 2022:
- Robert Tonyan Jr
- Cole Kmet
- Dawson Knox
- Greg Dortch
- Tyler Conklin
- Noah Fant
- Hunter Henry
- Hayden Hurst
- Rondale Moore
- Jerry Jeudy
and from 2021:
- Rondale Moore
- Gerald Everett
- Byron Pringle
- Mecole Hardman Jr.
- Noah Fant
- Braxton Berrios
- Jonnu Smith
- Dawson Knox
- Cole Beasley
- Robert Woods
and from 2020:
- Deebo Samuel
- Robert Tonyan Jr
- Demarcus Robinson
- David Moore
- Dawson Knox
- Dan Arnold
- George Kittle
- Drew Sample
- Allen Lazard
- Jordan Akins
You would think that a stat that showed how open players were getting would be good, right? All else being equal, it's better to be four yards away from the covering defender than three yards away from the covering defender. But do these lists pass the smell test?
Not really. There are a few good players on these lists. There are several more bad players here. Mostly, it's just a list of tight ends and gadget receivers who get a bunch of schemed bubble screens and the like.
If you doubted Ja'Tavion Sanders or Jordan Whittington coming out of the draft, is seeing their names on top of this list enough to convince you that you were wrong? Not likely; we might as well be looking at a list of players whose mothers have the longest maiden name, for all it seems to matter.
(Why are these lists so bad? Because of selection bias; NextGenStats measures separation at the moment the ball arrives. If you have Justin Jefferson, you go to him whether he's "open" or not. If you have Rondale Moore, you'd like to see a little bit more daylight before throwing it. The other three measures of separation I mentioned above do a much better job of adjusting for this.)
Developing a Leaderboard Reflex
We might see someone who was a fan of Whittington touting his 2nd-place standing as evidence they were right. We might see someone who advocated fading Marvin Harrison Jr. bringing up that he ranks 2nd-worst in average separation, ahead only of Ja'Lynn Polk. (This is true, incidentally-- though I wouldn't read too much into it; A.J. Brown ranks 3rd.)
These arguments might seem superficially compelling, but only because we lack the proper context to evaluate them. Before anything else, my first instinct is always to check the rest of the Top or Bottom 10.
If I was a fan of Malik Nabers (and really, at this point, who isn't?), I might tell you that he ranks 6th in TAY%, which stands for Total Air Yard Percentage-- yes, we're drowning in an alphabet soup, and I haven't even brought up "+/- xYAC/R" yet. Analytics has a lot to answer for.
TAY% is another stat from Next Gen Stats' list. It tracks how far downfield each receiver was on each target (i.e. the number of "air yards" the pass traveled) and then calculates what percentage of each team's total air yards a receiver has accounted for. It's a bit like target share, except it gives a bonus for targets further down the field.
Is ranking 6th in TAY% good? Let's check the current leaderboard:
- Calvin Ridley
- Terry McLaurin
- George Pickens
- Justin Jefferson
- Tyreek Hill
- Malik Nabers
- Garrett Wilson
- Marvin Harrison Jr.
- DK Metcalf
- Courtland Sutton
That's not a bad list! It's a bit biased toward players who have been the only viable target in their offense, but all of those players are certifiably good receivers. Nabers' presence in that Top 10 seems like a point in his favor. (And Harrison's, too.)
So the takeaway is that "percentage of air yards" is a positive indicator for receivers, but "average separation at the reception" is not. That's... kind of a weird conclusion. I wouldn't expect anyone to necessarily guess that that would be the outcome of this investigation. It seems like separation should matter, and if a guy's getting a ton of targets, why is it important how far down the field they are? These are potentially difficult positions to reach through reason alone. But they're trivially easy to reach if we just look at the leaderboard for each.
Intuitions are fallible, and they're not as good as rigorous statistical analysis. But rigorous statistical analysis is hard and boring and a lot of work, and most of us have better things to do. There's no need to let the perfect be the enemy of the perfectly fine. Raw intuition is an underrated tool for separating the wheat from the chaff and, in a world with an ever-increasing number of new statistics to navigate, quickly settling on what we care about while tuning out the noise.