Dynasty, in Theory: How Do Players Age?

We're (Still) Probably Thinking About Age the Wrong Way. Our Adam Harstad explains.

Adam Harstad's Dynasty, in Theory: How Do Players Age? Adam Harstad Published 11/09/2024

© Gregory Fisher-Imagn Images

There's a lot of strong dynasty analysis out there, especially when compared to five or ten years ago. But most of it is so dang practical-- Player X is undervalued, Player Y's workload is troubling, the market at this position is irrational, and take this specific action to win your league. Dynasty, in Theory is meant as a corrective, offering insights and takeaways into the strategic and structural nature of the game that might not lead to an immediate benefit but which should help us become better players over time.

We're (Still) Probably Thinking About Age the Wrong Way

I often say that thought experiments are my favorite type of experiment because they have all the trappings of science with none of that annoying, labor-intensive "data-gathering and testing" nonsense. To that end, I would like to propose a hypothetical. Imagine it is the end of the season and the top six fantasy receivers are as follows:

  • A 23-year-old former high draft pick who had his breakout campaign.
  • A 24-year-old former mid-round draft pick who had his second straight top season
  • A 25-year-old former high draft pick posting his third top year.
  • A 27-year-old former high draft pick with four big years.
  • A 28-year-old who posted his fifth top season.
  • A 29-year-old who likewise has five top seasons.

How many starter-caliber seasons do you think each receiver would have going forward? (For our purposes, we'll define "starter-caliber" as "over 11 points per game", which is usually around WR36 for the season. This year, receivers in the 11-12 point range include Tyreek Hill, Wan'Dale Robinson, Marvin Harrison Jr.., Courtland Sutton, DJ Moore, George Pickens, Quentin Johnston, etc.)

Take a minute to think about it if you would like.

Let's say that when I simulated possible career paths and selected one at random for each receiver, and upon doing so, found that five of the six receivers had either 6 or 7 seasons left as a fantasy starter. (The sixth had ten seasons left.)

  • The 23-year-old had 7 startable seasons left
  • The 24-year-old had 7 startable seasons left
  • The 25-year-old had 10 startable seasons left
  • The 27-year-old had 6 startable seasons left
  • The 28-year-old had 7 startable seasons left
  • The 29-year-old had 6 startable seasons left
An example of PPG Averages Going Forward
This is one potential way those receivers' careers could play out

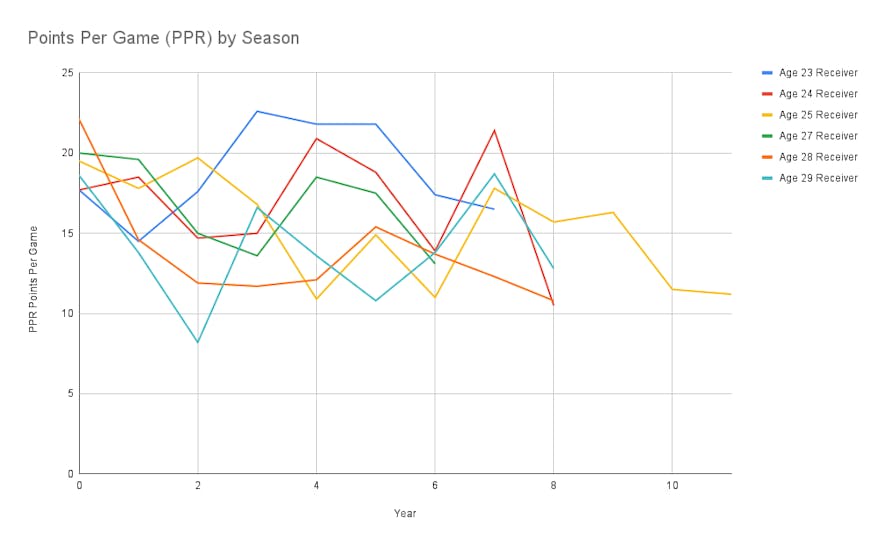
Would you find this outcome implausible? Would you consider it bizarre that the three older receivers essentially lasted as long as the three younger receivers? Would you question how well-calibrated my simulation was?

I hope not, because the "hypothetical season" was 2008, the "hypothetical receivers" were Calvin Johnson, Brandon Marshall, Larry Fitzgerald, Andre Johnson, Anquan Boldin, and Steve Smith, and those are their actual remaining career point per game averages in the graph above.

Let's Talk About Age Curves

The most common way to think about longevity in dynasty is through something called an age curve. You've likely seen one at some point-- they typically show average production by age, with performance starting low, improving over the first few years of a player's career, reaching a peak in the mid-to-late 20s, and then entering a steady decline. Here's a classic example from Chase Stuart of Football Perspective.

There are lots of ways to produce the quintessential curve. The most common is to average production of all players at each age. Another approach is to define a player's best year as his peak, express every age as a percentage of that peak, and average those percentages. (So if a running back's best year is 200 points at Age 24, and that back scores 190 at Age 25, his production for Age 25 is 95% of his peak.)

I've also seen analysts calculate the improvement or decline from year to year and average those to find that, say, running backs typically improve by 10% between age 22 and 23, but decline by 15% between age 27 and 28. Alternately, if you chart every, say, 250-point season in history by age, you once again wind up in the same place.

Each of these approaches produces a curve-- but more than that, each of these approaches produces a largely identical curve. This convergence can't be a coincidence; it's no wonder age curves have become the dominant mode for thinking about aging in fantasy football.

Except there are a lot of problems with age curves, which is why I wrote in 2015 that we were probably thinking about age the wrong way.

Already a subscriber?

Continue reading this content with a ELITE subscription.

An ELITE subscription is required to access content for Dynasty leagues. If this league is not a Dynasty league, you can edit your leagues here.

 The biggest problem with using age curves to predict individual career outcomes is that... individual careers are virtually never curve-shaped. Here's the entire fantasy careers of the six receivers above (minus any sub-10 ppg seasons at the beginning or end of their career).

PPG by Age
Six non-curve-shaped careers


If you squint, you can see a bit of a curve emerge from the overall whole-- mostly because eight of the eleven seasons over 20 points per game came at Age 26, 27, or 28, with one exception each at Age 24, 25, and 31. That pronounced local maximum creates the weak appearance of a curve.

But outside of that peak, those careers are much closer to a straight line than a curve. (As an exercise, try covering that section with a finger and looking at the resulting graph.) Down years are as likely to rebound into up years as they are to continue their downward trend, which contradicts what an age curve would predict. Every age up to 36 has examples of receivers performing better than they did the year before, which flies in the face of the supposed decline.

If you look at each line individually, Calvin Johnson's is the only one that seems to conform to the traditional curve (and then likely only because Johnson retired in his prime and therefore missed out on a lot of the up-and-down through his 30s).

(The fact that relationships that are true at the population level are not necessarily true at the individual level is known as ecological fallacy, and it's how we can produce such strong and consistent curves when averaging a bunch of distinctly non-curve-shaped careers.)

I could overlook the fact that individual careers were rarely curve-shaped if the predictions that followed from age curves had a strong track record of success. But they don't. Age curves suggest aging is an orderly, predictable, deterministic process... and as the example above shows, it's not.

Predicting the Future in a Non-Deterministic Universe

If not age curves, is there any way we can model player aging processes that will match what careers actually look like? In my 2015 article, I proposed borrowing from actuarial tables (or "mortality tables")-- the tools used to estimate longevity so life insurance companies can set prices, the government can project spending, etc.

Looking at the six careers above (and hundreds of other careers besides), I was struck by how flat they tended to be. Players seemed to have a "true production level" and they largely just bounced around that for a while until they suddenly fell out of relevance entirely. This "age cliff" was unpredictable-- there are examples of receivers falling off at virtually every age-- but it became more and more likely the older a player became.

As a result, aging could best be modeled as random fluctuations around a fixed mean interrupted by a sudden, unpredictable, and catastrophic decline (or, from an actuarial standpoint, "death").

I find that this approach has a lot of advantages. For one thing, it expects younger players to last longer than older ones... but not at a 1-to-1 ratio. A 28-year-old is not expected to have four fewer prime seasons remaining than a 24-year-old; the 28-year-old has already "survived" four potential cliffs that the 24-year-old will still have to navigate.

(The exact values vary by position, but for example, I found based on historical survival rates at the time, a 28-year-old receiver should have an average of 3.6 prime seasons remaining, while a 24-year-old has 6.2-- a difference of about 2.6 seasons for a four-year age gap.)

I'll post the full "expected years remaining by age and position" for anyone curious, but please note that these values were calculated a decade ago, and as I noted last December, NFL careers have almost certainly been getting shorter since then.

A second advantage of mortality tables over age curves is they're more open to outliers. An age curve sees Derrick Henry and notes that he's 30 and declined last year, so it might suggest we'll see 60% of prime Derrick Henry this year. A mortality table, however, says that random fluctuations are normal, so a down year is not dispositive. It instead might suggest there's a 60% chance we'll see prime Derrick Henry this year-- a subtle difference, but rather an important one. (Especially as it pertains to Derrick Henry this year!)

The final big advantage of a "mortality tables" mindset over an "age curves" mindset is that, while "remaining seasons" is often expressed as a single point, mortality tables naturally capture a wide range of outcomes. A 28-year-old receiver might have 3.6 seasons left, but in reality there's a chance he has zero years left, a chance he has one, a chance he has two, and so on. The "3.6" we see is the result of averaging all those possibilities.

I first made the comparison between Andre Johnson, Larry Fitzgerald, and Calvin Johnson back in 2016, when Calvin was retired and Andre was still in the league. I calculated that for a given 24-year-old and 28-year-old receiver, there was a 10% chance that the 28-year-old would still be going in four years and the 24-year-old would not. That's not likely, but it's not especially unlikely either.

I ended that column by noting that that was precisely the age difference between Odell Beckham Jr (who was nearly unanimously the most valuable player in dynasty at the time) and A.J. Green. Neither receiver has been especially fantasy-relevant for a while now, but the last time Beckham topped 600 receiving yards was 2019; Green had 850 in 2021.

The Final Case for A Mortality Mindset

Age curves were a huge step forward from what came before (which was largely "don't pay attention to a player's age at all"), but they have significant flaws. Thinking of performance as random fluctuation with a risk of unpredictable and catastrophic decline (that increases the older a player becomes) corrects for many of those flaws.

First, it actually matches observed careers. Age curves predict that players shouldn't improve in their thirties, but they do. Age curves predict that Jerry Rice never should have lasted until his 40s, but he did. Mortality tables easily accommodate both possibilities.

Second, it naturally respects uncertainty. Mortality tables allow that Derrick Henry might be a league-winner at 30 when he "should" be in decline, and they also allow that Odell Beckham Jr might be done at 28 when he should be at his peak. Neither is necessarily likely, but both are plausible.

Third, it more accurately values the differences between players of different ages, recognizing that the pool of "good seasons left" isn't fixed and "surviving" another year doesn't use one of them up-- it just moves you to a slightly higher risk class going forward.

The fantasy community is still probably thinking about age the wrong way-- a series of orderly and predictable improvements and declines rather than a string of chaotic fluctuations punctuated by a dramatic and unpredictable fall. But that's good news for us; others' errors are our opportunities.


Photos provided by Imagn Images

More by Adam Harstad


Dynasty, in Theory: Do the Playoffs Matter?

Adam Harstad

Should we include playoff performances when evaluating players?

01/18/25 Read More
 

Odds and Ends: Divisional Round

Adam Harstad

Examining past trends to predict the future.

01/17/25 Read More
 

Odds and Ends: Wild Card Weekend

Adam Harstad

Examining the playoff futures and correctly predicting the Super Bowl winner.

01/10/25 Read More
 

Dynasty, in Theory: Evaluating Rookie Receivers

Adam Harstad

Revisiting this year's rookies through the lens of the model

01/09/25 Read More
 

Dynasty, in Theory: Consistency is a Myth

Adam Harstad

Some believe consistency helps you win. (It doesn't.)

01/04/25 Read More
 

Odds and Ends: Week 18

Adam Harstad

How did we do for the year? Surprisingly well!

01/02/25 Read More